

Regulating Effect of Exogenous Melatonin on Aluminum Toxicity in Solanum lycopersicum L.
-
摘要:目的 研究褪黑素对铝胁迫下番茄生理上的调控作用,为缓解土壤酸铝化对番茄生长造成的不利影响提供理论依据。方法 以耐铝品种千禧番茄和铝敏感品种普罗旺斯番茄为供试植物,设置空白组、单铝组、褪黑素(MT)处理组和铝+褪黑素共同施加组,测定各处理组生长周期(10 d、20 d、30 d)过程中番茄叶片抗氧化酶[超氧化物歧化酶(SOD)、过氧化物酶(POD)和过氧化氢酶(CAT)]活性、丙二醛(MDA)、脯氨酸(Pro)、抗坏血酸(AsA)、谷胱甘肽(GSH)含量、叶绿素含量和叶绿素荧光参数,检测根部铝富集含量和根系活力,并对番茄的根、茎、叶进行DNA损伤检测。结果 铝逆境下两品种番茄生长发育均受到严重抑制,各器官DNA均受损严重,且其根系DNA损伤最为严重。施用褪黑素能够明显缓解番茄的铝毒症状,两品种番茄株高、根长及叶面积等主要生长指标均有所增长;抗氧化酶活性得到显著提高,且随实验周期延长呈现先上升后下降的趋势;GSH和AsA含量最大增幅达91.14%、13.52%;MDA含量降幅最大可达38.39%,脯氨酸含量增幅可达144.81%,调节番茄体内渗透平衡;叶绿素含量明显升高,各项荧光参数得到改善,恢复其光合能力;千禧番茄和普罗旺斯番茄根系活力增幅分别为5.19%和43.03%,两者的根、茎、叶铝富集能力均降低。同时,施加褪黑素也能够有效减缓番茄各器官DNA拖尾现象,修复细胞DNA损伤。结论 施加外源褪黑素能有效激活铝胁迫下番茄的各项生理响应,促进其生长发育,不仅能提高抗氧化酶系统活性,增强光合能力与根系活力,还可以减少植株体内铝含量,降低细胞DNA受损程度,进一步提升其抗铝能力,为探索MT对逆境下植物的调控作用提供新思路。Abstract:Objective Regulating effect of melatonin application on the physiology of a tomato plant under aluminum stress was studied.Method Al-tolerant Millennial tomato and Al-sensitive Provence tomato plants were grown in blank control, Al-added, melatonin-added (MT), or Al-and-melatonin-added (AMT) potting soils. Activities of superoxide dismutase (SOD), peroxidase (POD), and catalase (CAT), contents of malondialdehyde (MDA), proline (Pro), ascorbic acid (AsA), glutathione (GSH), and chlorophyll as well as chlorophyll fluorescence parameters, Al-accumulation, and root activity in the plants were monitored. DNA damage occurred to the roots, stems, and leaves of the plants during the experimentation were recorded. Statistical analysis was performed on all collected data using the one-way ANOVA and Duncan test.Result Under Al-stress, the growth and development of the tomato plants of either variety were severely inhibited, and the DNA in the organs, especially the roots, seriously damaged. Whereas the presence of melatonin in the soil (MT and/or AMT ) significantly alleviated the symptoms of Al-toxicity on the plants. For instance, with the addition, the main growth indicators, such as plant height, root length, and leaf area, were improved; the activity of antioxidant enzymes significantly heightened with an increasing trend initially and followed by a decline as treatment duration prolonged; the contents of GSH and AsA raised by 91.14% and 13.52% respectively; the reduction on MDA maximized at 38.39%; proline, which regulates the osmotic balance in tomato, increased to 144.81% and chlorophyll significantly; the fluorescence parameters improved; the photosynthetic capacity much restored; the root activity of Millennial tomato plant increased by 5.19%, and that of Provence tomato by 43.03%; the Al-accumulation in the roots, stems, and leaves significantly reduced; the DNA tailing in organs slowed; and the repairs on damaged DNA in cells observed.Conclusion Applying exogenous melatonin in soil effectively activated various physiological responses, raised the activity of antioxidant enzymes, enhanced the plant photosynthesis, reduced damage on cellular DNA, and elevated the resistance to Al-toxicity of the tomato plants under the heavy metal stress.
-
Keywords:
- Melatonin /
- Solanum lycopersicum /
- aluminum stress /
- physiological response /
- DNA damage
-
0. 引言
【研究意义】随着科技的进步,现代农业产业不断往高度集约化与高效种植方向发展,现代化农业设施得到广泛应用。我国设施园艺栽培面积高居世界首位,2016年已达到476.5万hm2,产值超1.46万亿元[1]。农业设施的补光问题日益凸显,人造光源在植物光照中发挥着越来越重要的作用,试验表明LED光源相对传统光源在植物光照方面有明显的优势[1]。以纯人工光为光源的植物工厂代表了设施农业的发展趋势,植物对光吸收的效率决定了设施农业产业的经济效益,因此寻找植物生长所需的最佳复合光谱是关键。植物特征光谱代表了植物在某个生长周期内的最佳光需求[2],若能够依据植物特征光谱精准给光,将有效促进植物产量和品质的提高,从而提高设施农业产业模式的社会经济效益[3]。植物特征光谱是以植物在多种单色光条件下的光合响应曲线为基础进行定义的[2],因此,研究植物在单色光照射条件下的光合响应曲线及其数学模型,对植物光照应用领域具有重要理论价值与实践指导意义。【前人研究进展】当前,在设施农业中普遍采用LED人工光源补光或进行全人工光栽培,对植物在不同光照环境下表现出的相应特性的研究也越来越多[4-14]。植物的生长及其有效成分的积累与光的波长、强度和光周期密切相关[1]。对于以白光为基础的光合响应曲线模型的研究也有许多成果[15-22]。【本研究切入点】目前的研究基本上都采用红绿蓝三色光为光源,此类光的光谱仅为植物光合有效辐射范围的一部分,无法反映植物光合响应的全貌。仅用三色光对植物进行光照培育,可能会导致植物因为部分波长的光的缺失而出现相应的不良生长现象。同时,在对植物光合响应模型的相关研究中,有关植物在单色光条件下——即将光波长作为光合响应重要影响参数的研究有待深入进行。【拟解决的关键问题】以获取植物特征光谱——即植物在一定环境(非光)中进行光合作用最适宜的光谱、光照强度和光照周期为出发点,选择10种具有代表性的植物幼苗作为试验对象,采用自主研制的多种单色光发生器搭建光合作用(速率)测试系统[2],开展植物在多种单色光条件下的光合响应研究,根据单色光条件下光合响应饱和点实测数据,分析、建立具有较高拟合度的光合响应曲线及数学模型,以期发现植物在不同波长光照射下所呈现光合响应特性的一般规律,为最终形成植物特征光谱提供理论依据和数据支撑。
1. 材料与方法
1.1 试验材料
2021年6月,样本取自南平市森科种苗有限公司苗圃,该苗圃位于延平区西芹镇坑底村,海拔60 m,湿度65%~100%,介于北纬26°15′~26°52′,东经117°50′~118°40′,属中亚热带海洋季风气候,年均气温17.3 ℃(夏季温度30~40 ℃),年降水量1 669 mm。苗圃为露天的普通林地培育树苗,光照较强。在该苗圃取一年生长势良好的10个品种树苗:红椎、马褂木、红花荷、苦槠、乐昌含笑、闽楠、木荷、刨花楠、乳源木莲和油茶。限于篇幅,选择两个具有代表性的树苗红椎和马褂木的测试数据进行分析研究。
1.2 试验仪器
自主研制的多种单色光发生器,该设备由一种双驼峰型光谱的发光装置[23],它产生24~30种单色光,测试试验选择22种单色光,其峰值波长及其对应的半峰全宽如表1所示,该装置具有任意选择单色光的波长并调节其光强的功能,可以根据需要选择单色光和相应的光强。CIRAS-3光合作用测试仪(美国,PP SYSTEMS公司),能够测试在一定光强条件下的植物光合作用速率、气孔导度和蒸腾速率等重要的物理参数。由这两台设备组成普通光植物特征光谱测试系统[2]。
表 1 多种单色光发生器产生的22种单色光Table 1. Twenty-two monochromatic lights produced by light generating device波长
Wavelength λ/nm半峰全宽
Full width of
half peak ∆λ/nm波长
Wavelength λ/nm半峰全宽
Full width of
half peak ∆λ/nm420 13.9 575 22.6 435 17.9 600 20.3 445 12.9 620 17.9 450 19.4 630 17 465 15.6 650 20.5 475 25 660 11.8 500 24.2 675 26.3 520 20.5 690 26.6 535 18.7 700 33.7 550 22.4 730 28.2 565 15.7 750 28.8 1.3 试验方法
按光合作用测试仪使用的常规要求,选择树苗上第3~4个发育正常的叶片,置于叶室里,采用植物特征光谱试验方法[2]进行测试,即任选多种单色光发生器产生的一种单色光,让其均匀地照射在光合作用测试系统的叶室上,通过光合作用测试系统就可以获得被测试的植物在该单色光此刻对应的光强下的光合作用速率。为了避免杂光的干扰,从出光口到叶室,采取遮光措施。按由小到大的顺序调整该单色光的光合有效辐射强度PAR(以下简称光强I/µmol·m−2·s−1,分别为10,20,30,40,60,80,100,150,200,300,400,……,最大值),获得该单色光在不同光强条件下的光合作用速率,即光合作用速率与光强的关系曲线,通常称之为单色光植物光合作用响应曲线(以下简称光合响应曲线)。
1.4 数据处理的工具与方法
应用Matlab 2012b软件中的Curve Fitting Tool曲线拟合工具箱(以下简称CFT工具)对所获得的光合作用速率及其对应的光强数据进行曲线拟合,获得每一种单色光的光合响应曲线,该工具箱采用的是非线性最小二乘法的信任区域理论(Trust Region Methods)求解模型参数(以下简称TRM方法)。
1.5 光合响应曲线的模型
根据有两类不同的单色光光合响应曲线的试验结果,考虑到不同波长的光合响应曲线的差异,分别采用不同的模型来描述。
对于渐近线型植物单色光光合响应曲线采用以下模型来描述。
Pn=PnB(1 - e - αλ(I - Ic)) (1) 式中
Pn 为净光合速率,I 为光强,Ic 为补偿点对应的光强,对于特定的树种和特定的波长Ic 为常数,PnB 为准饱和点光强对应的光合速率,αλ 为响应系数。由式(1)可知,当I=Ic 时,Pn=0 ,这与试验测试结果相符。对于有拐点的植物单色光光合响应曲线,采用以下模型来描述。
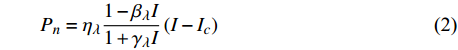
Pn=ηλ1−βλI1+γλI(I−Ic) (2) 式中
Pn 为净光合速率,I 为光强,Ic 为补偿点对应的光强,ηλ 为补偿响应系数,βλ 为修正系数,γλ=ηλ/Pmax 为补偿比率系数,其中{P_{\max }} 为植物的最大光合作用速率。由式(2)可知,当I = {I_c} 时,{P_n} = 0 ,同样与试验测试结果相符。1.6 渐近线型光合响应曲线的准饱和点光强计算方法
对于渐近线型植物光合响应曲线不存在光合作用速率最大值
{P_{\max }} ,在植物光照中,当光强达到一定值时,植物的光合作用速率随着光强增加其增量开始减少,当光强达到某一上限值时,再增加光强,对植物的生长没有实际意义,在纯人工光植物工厂中,植物光照的光强通常在200~400 µmol·m−2·s−1[3]。因此,有必要根据植物栽培的实际来确定合理的光强上限值,该值就称为准饱和点光强。可将式(1)求一阶导数得:{P'_n} = {\alpha _\lambda }{P_{nB}}{e^{ - {\alpha _\lambda }\left( {I - {I_c}} \right)}} (3) 采用TRM方法进行求解,可获得相关的参数,即a=
{P_{nB}} ,b={\alpha _\lambda } ,c={I_c} 。如果确定{p'_n} 值,即可由式(3)求出{I'_{sat}} ,即{p'_n} 值确定后,由式(3)计算出的理论计算值{I'_{sat}} 为准饱和点光强。1.7 有拐点植物光合响应曲线的饱和点光强计算方法
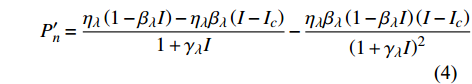
对应有拐点光合响应曲线的饱和点光强的确定,就是将式(2)求一阶导数,可得:
P_n^{\prime}=\frac{\eta_\lambda\left(1-\beta_\lambda I\right)-\eta_\lambda \beta_\lambda\left(I-I_c\right)}{1+\gamma_\lambda I}-\frac{\eta_\lambda \beta_\lambda\left(1-\beta_\lambda I\right)\left(I-I_c\right)}{\left(1+\gamma_\lambda I\right)^2} (4) 当式(4)等于0时,就可获得饱和点光强
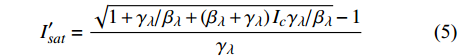
{I'_{sat}} 的表达式,即{I'_{sat}} = \frac{{\sqrt {{{1 + {{{\gamma _\lambda }} \mathord{\left/ {\vphantom {{{\gamma _\lambda }} {{\beta _\lambda }}}} \right. } {{\beta _\lambda }}} + \left( {{\beta _\lambda } + {\gamma _\lambda }} \right){I_c}{\gamma _\lambda }} \mathord{\left/ {\vphantom {{1 + {{{\gamma _\lambda }} \mathord{\left/ {\vphantom {{{\gamma _\lambda }} {{\beta _\lambda }}}} \right. } {{\beta _\lambda }}} + \left( {{\beta _\lambda } + {\gamma _\lambda }} \right){I_c}{\gamma _\lambda }} {{\beta _\lambda }}}} \right. } {{\beta _\lambda }}}} - 1}}{{{\gamma _\lambda }}} (5) 根据试验测试获取马褂木数据,采用TRM方法进行求解,得到马褂木对各波长对应的
{\eta _\lambda } 补偿响应系数、{\beta _\lambda } 修正系数、{\gamma _\lambda } 补偿比率系数和补偿点光强{I_c} 。再由式(5)就可以获取马褂木的饱和点光强理论计算值
{I'_{sat}} 。2. 结果与分析
2.1 光合响应曲线及其特点
选择22种单色光,采用植物特征光谱的试验方法,进行试验测试,获得的数据应用CFT工具进行模拟,分别获得了10种树苗的22种波长的光合响应曲线。
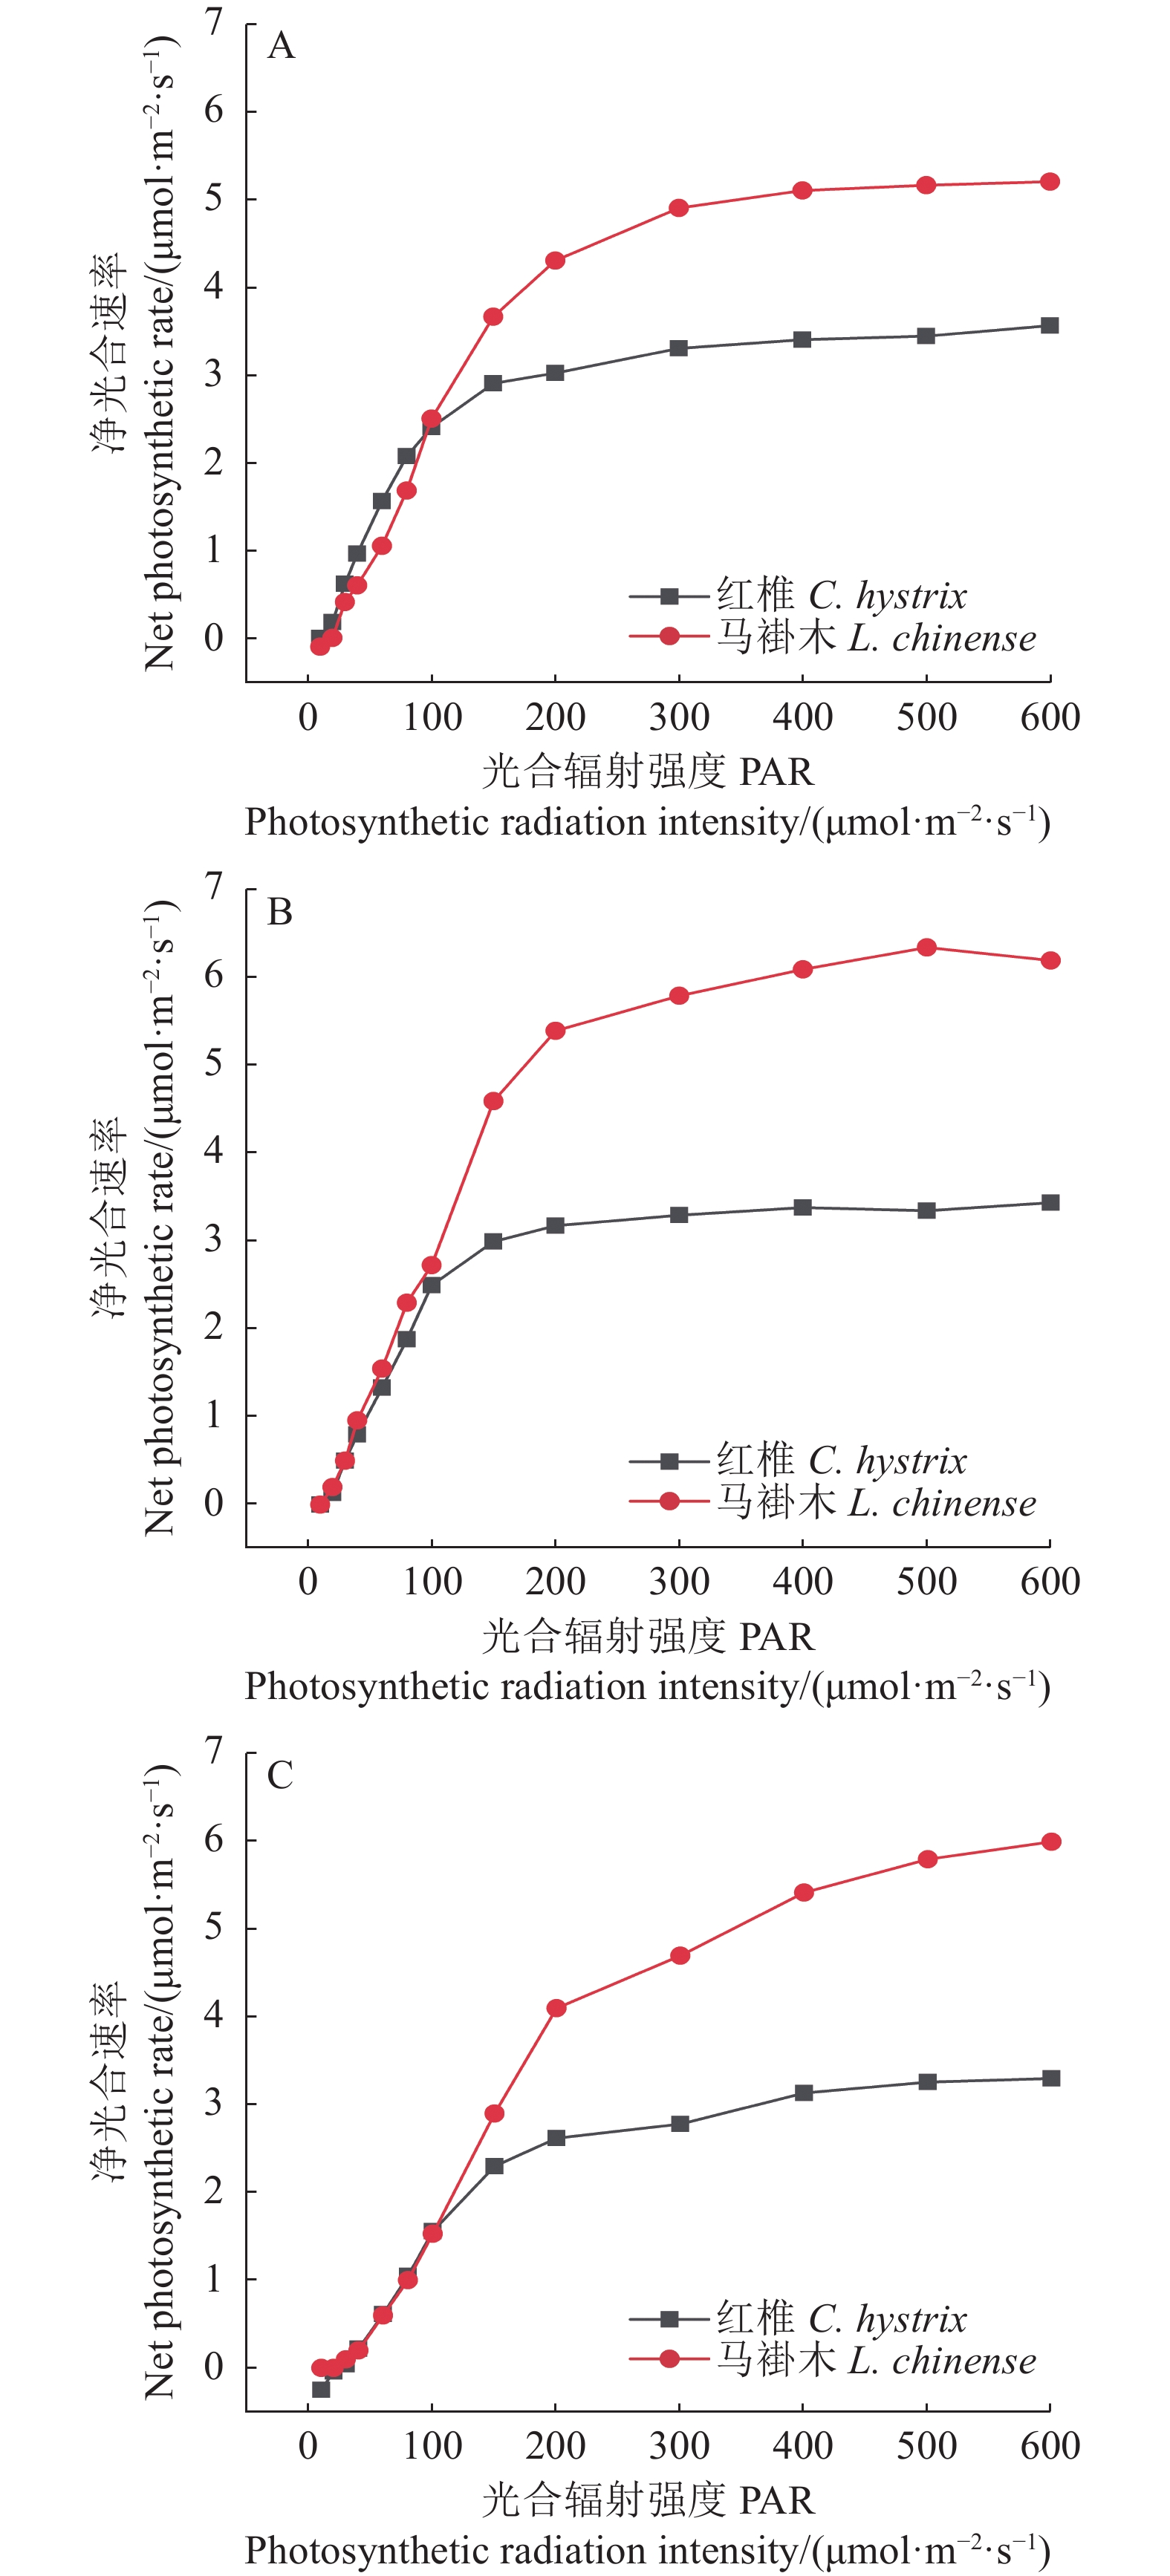
试验结果表明,树苗的光合响应曲线有两类:一类是渐近线型光合响应曲线,另一类是有拐点的光合响应曲线。具有代表性的树种分别为红椎和马褂木。红椎的光合响应曲线是渐近线型曲线,这类树种的光合响应曲线没有极值;马褂木的光合响应曲线则是有拐点的曲线,这类曲线有极值。由此可见,同一树苗对不同波长的光合响应曲线是不同的,不同树苗对同一波长的光合响应曲线也明显不同。
从图1~3还可以看出光强在20~100 µmol·m−2·s−1光合响应曲线接近是线性的,超过100 µmol·m−2·s−1以后光合响应曲线的特异性表现得比较明显,说明植物光合响应的差别在100 µmol·m−2·s−1以后表现得更为显著。
![]() 图 3 红椎和马褂木对3种不同波长的光合响应曲线A、B、C分别表示波长为435、600、700 nm。Figure 3. LRCs of C. hystrix and L. chinense exposed to lights of 3 different wavelengthsA, B and C represent wavelengths of 435 nm, 600 nm and 700 nm respectively.
图 3 红椎和马褂木对3种不同波长的光合响应曲线A、B、C分别表示波长为435、600、700 nm。Figure 3. LRCs of C. hystrix and L. chinense exposed to lights of 3 different wavelengthsA, B and C represent wavelengths of 435 nm, 600 nm and 700 nm respectively.2.2 渐近线型光合响应曲线的准饱和点光强
表2为红椎的光合响应曲线对应22个单色光的
{P_{nB}} ,{\alpha _\lambda } ,{I_c} 参数值。从表2可以看出,各种单色光的准饱和点光强对应的最大光合作用速率Pnb是不同的,该点构成的谱线有6个峰值,分别是:3.50、3.95、4.47、3.51、3.51、5.64,对应的波长分别为445、535、565、630、565、750 nm;补偿点的实测值与模型的理论值的相关系数的平方值R2大部分在0.99以上或只有少数接近0.99,说明该模型应用于补偿点是成功的。表3为红椎的准饱和点光强的实测值{I_{sat}} 与{p'_n} = 0.001 时的理论计算值{I'_{sat}} 的比较。从表3可以看出有8个波长没有对应的实测值,无法测出准饱和点的实测值,即按照设定的连续3档光强值,测定的光合作用速率的读数误差小于1%,则判定中间挡光强值为准饱和点的光强值,不满足该条件的测试结果则不予采用,即没有对应的实测值。其他确认的实测值与理论值均在设定值档位差值(±100)的范围之内,因此,可认为实测值与理论值基本上是吻合的,即式(1)模型是正确的。表 2 红椎的光合响应曲线对应22个单色光的参数值Table 2. Measurements related to 22 monochromatic lights on LRC of C. hystrix波长
Wavelength
λ/nmPnb Ic/
(μmol·m−2·s−1)Ic′/
(μmol·m−2·s−1)αλ/
(m2·s−1·μmol−1)R2 波长
Wavelength
λ/nmPnb Ic/
(μmol·m−2·s−1)Ic′/
(μmol·m−2·s−1)αλ/
(m2·s−1·μmol−1)R2 420 3.45 5 12 0.015 0.995 2 575 3.14 15 14 0.01 0.995 8 435 3.47 10 13 0.013 0.996 4 600 3.45 10 15 0.013 0.990 9 445 3.5 10 14 0.012 0.993 8 620 3.45 10 14 0.015 0.990 1 450 3.09 10 14 0.013 0.993 6 630 3.51 15 14 0.013 0.993 465 3.12 15 17 0.013 0.996 8 650 3.44 15 15 0.016 0.991 7 475 2.83 10 12 0.013 0.997 2 660 3.37 10 12 0.015 0.998 500 3.13 15 12 0.011 0.995 8 675 3.28 10 11 0.014 0.996 3 520 3.51 15 13 0.013 0.985 4 690 2.81 10 6 0.007 4 0.988 7 535 3.95 15 16 0.012 0.993 1 700 3.33 25 25 0.007 8 0.991 5 550 3.31 15 17 0.011 0.994 7 730 3.59 30 24 0.007 8 0.987 4 565 4.47 15 12 0.006 9 0.998 750 5.64 25 20 0.002 2 0.987 5 表 3 红椎的准饱和点光强实测值{I_{sat}} 与理论计算值{I'_{sat}} 的比较({p'_n} = 0.001 )Table 3. Measured{I_{sat}} and theoretical{I'_{sat}} at quasi-saturation point of C. hystrix({p'_n} = 0.001 )波长
Wavelength λ/nmIsat/
(μmol·m−2·s−1)Isat’/
(μmol·m−2·s−1)波长
Wavelength λ/nmIsat/
(μmol·m−2·s−1)Isat’/
(μmol·m−2·s−1)420 —— 273 575 —— 347 435 300 311 600 300 313 445 300 316 620 200 284 450 300 293 630 200 301 465 300 299 650 200 264 475 200 287 660 400 276 500 —— 328 675 400 287 520 —— 301 690 500 416 535 —— 338 700 500 441 550 300 342 730 —— 449 565 —— 506 750 —— 1154 2.3 有拐点植物光合响应曲线的饱和点光强
表4显示:相邻波长对应的补偿响应系数比较接近,整个有效辐射波段最大的差值为32×10−3,修正系数也是如此,整个有效辐射波段的最大差值为2.09×10⁻³,补偿比率系数的差别比较大,这是因为它是补偿响应系数与最大的光合作用速率的比值,由于各波长对应的最大光合作用速率的值差别很大所造成的。从表4还可看出各波长对应的补偿点光强的实测值与模型理论计算值吻合的比较好,相关系数的平方值接近0.99,说明该模型能够准确描述补偿点随波长变化的规律。
表 4 马褂木的补偿响应系数、修正系数、补偿比率系数和补偿点光强Table 4. Compensation response coefficient, correction coefficient, compensation ratio coefficient, and light intensity at compensation point of L. chinense波长
Wavelength
λ/nmηλ
(10−3)βλ
(10−3)γλ
(10−3)Ic/
(μmol·m−2·s−1)Ic’/
(μmol·m−2·s−1)R2 波长
Wavelength
λ/nmηλ
(10−3)βλ
(10−3)γλ
(10−3)Ic/
(μmol·m−2·s−1)Ic’/
(μmol·m−2·s−1)R2 420 37 1.3 1.8 20 21 0.982 7 575 42 0.86 2 10 17 0.991 1 435 44 0.52 3.9 20 20 0.991 6 600 52 0.62 3.3 10 16 0.990 4 445 61 0.48 6.2 10 15 0.992 7 620 57 0.2 6.2 20 18 0.996 2 450 56 0.43 7.5 15 17 0.988 630 66 0.38 5.3 10 16 0.984 5 465 39 1.1 1.1 20 18 0.992 9 650 55 0.61 3.1 15 16 0.994 7 475 62 0.47 5.6 10 18 0.991 6 660 57 0.9 2.6 10 15 0.995 3 500 46 1.8 9.1×10⁻⁸ 10 18 0.994 9 675 67 0.31 6.5 10 14 0.996 5 520 36 1.8 8.4×10⁻⁷ 20 21 0.988 8 690 36 0.35 2.5 10 11 0.994 4 535 41 2 0.78 15 14 0.995 700 36 0.33 2.9 25 33 0.993 550 34 1.4 0.28 20 19 0.998 3 730 25 0.92 1.7×10⁻⁷ 15 25 0.996 8 565 38 2.4 6.3×10⁻⁷ 20 16 0.991 8 750 35 1.8 0.99 20 18 0.999 1 表5为马褂木饱和点光强的实测值
{I_{sat}} 与理论计算值{I'_{sat}} 的比较。由表5可知:饱和点光强的实测值与模型理论计算值的一致性程度比较高,说明式(5)能够准确地描述饱和点光强随波长变化的规律,即式(2)理论模型是成功的。表 5 马褂木饱和点光强的实测值与理论计算值比较({p'_n} = 0 )Table 5. Measured and theoretical values of light intensity at saturation point of L. chinense ({p'_n} = 0 )波长
Wavelength λ/nmIsat/
(μmol·m−2·s−1)Isat’/
(μmol·m−2·s−1)波长
Wavelength λ/nmIsat/
(μmol·m−2·s−1)Isat’/
(μmol·m−2·s−1)420 400 324 575 —— 429 435 600 521 600 500 478 445 600 465 620 800 808 450 500 472 630 700 573 465 300 385 650 500 494 475 500 491 660 400 390 500 300 281 675 600 594 520 —— 292 690 700 755 535 —— 249 700 900 780 550 —— 352 730 —— 553 565 —— 218 750 —— 252 2.4 饱和点曲线和补偿点曲线
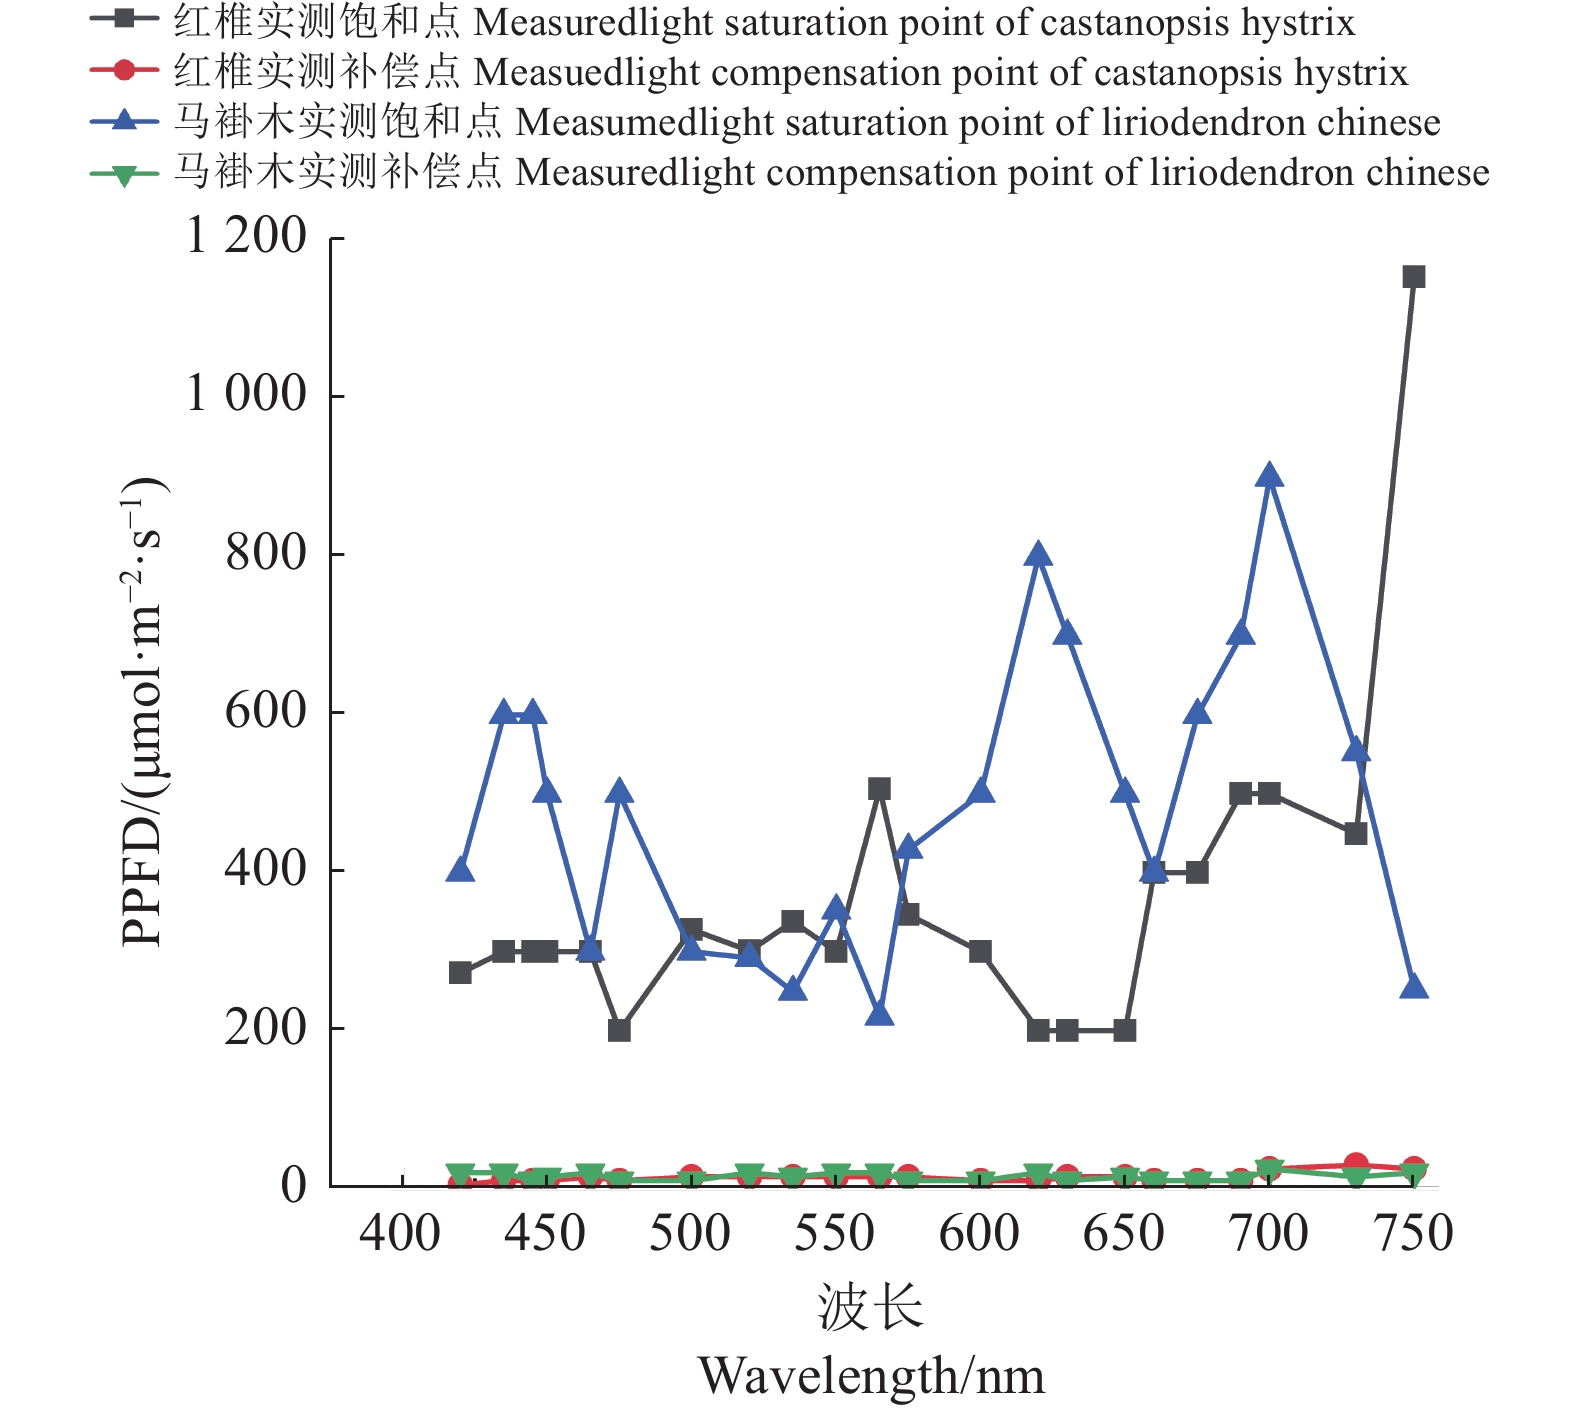
根据表1~4所确定的饱和点光强
{I_{sat}} 以及试验获取的补偿点光强{I_c} ,可以分别做出红椎与马褂木的实测饱和点曲线和补偿点曲线,如图4所示。图中饱和点曲线以饱和点光强实测值为主,对于因单色光光强的因素无法测试到饱和点光强的6个点,采用饱和点光强的理论计算值,所绘出的饱和点曲线,不影响获取该植物特征光谱的试验验证。![]() 图 4 红椎与马褂木的饱和点曲线和补偿点曲线Figure 4. Light saturation and compensation curves of C. hystrix and L. chinense
图 4 红椎与马褂木的饱和点曲线和补偿点曲线Figure 4. Light saturation and compensation curves of C. hystrix and L. chinense2.5 获取植物特征光谱的方法
每一种植物均可采用植物特征光谱试验方法,获取图4相似的饱和点曲线和补偿点曲线,这是获取植物特征光谱的第一步,以此为依据,在饱和点曲线和补偿点曲线之间选择类似于饱和点曲线的多种光谱(如30种)进行栽培试验,通过比较选择长势最好和产量最高的前5种光谱所栽培的植物实体,进行有效成分的测试与分析,综合评判确定的最佳光谱为植物特征光谱。
3. 讨论与结论
采用植物特征光谱的试验方法,应用植物特征光谱测试系统进行测试,获取了红椎和马褂木两种树苗对22种波长的一系列光强对应的光合作用速率数据,采用CFT工具箱对这些数据进行曲线拟合,分别获得两个树苗的22条单色光的光合响应曲线,相关系数的平方值R2都在0.99以上,说明拟合度很好。同时采用TRM方法求解式(1)和式(2)两个模型对应的参数,进而获得渐近线型光合响应曲线树苗(红椎)的准饱和点光强和有拐点的光合响应曲线(马褂木)饱和点光强的理论计算值,绝大部分的数据比较接近,说明公式(1)可以作为描述渐近线型光合响应曲线类植物光合作用速率的一个重要数学模型。而从表4的数据看,饱和点光强的实测值与理论计算值的吻合程度没有表2的数据那么好,但是,大部分的数据比较接近,说明式(2)是描述有拐点的光合响应曲线类植物光合作用速率的一个比较好的数学模型。补偿点光强的实测值与模拟理论值很接近,而且随波长的变化也不大,由此可以得出结论:植物的补偿点光强与波长的相关性很小,说明在光合有效辐射的波长范围内,任何波长的光只要光强达到该植物的补偿点光强,则该植物的光合作用就能够启动。准饱和点光强对应的光合速率
{P_{nB}} 随波长的变化也很小,响应系数{\alpha _\lambda } 随波长的不同而变,是波长的函数。补偿响应系数{\eta _\lambda } 、修正系数{\beta _\lambda } 、补偿比率系数{\gamma _\lambda } 均随波长的变化而不同,体现出不同植物光合作用规律的特点。综上所述,通过植物特征光谱试验方法及其普通光植物特征光谱测试系统可以获得{P_{nB}} 、{\alpha _\lambda } 、{\eta _\lambda } 、{\beta _\lambda } 、{\gamma _\lambda } 等与光合特性有关又能体现植物自身特点的参数,说明该方法及其系统是研究植物光合特性的普遍方法及通用装备。从试验数据拟合出的单色光植物光合响应曲线中,发现了树苗的光合响应曲线可以分成两类的现象,可能对树种的分类有帮助,其机理有待进一步研究。致谢:感谢南平市森科种苗有限公司薛华同志的支持和帮助。
-
![]()
图 1 各处理下番茄根系活力的变化
不同小写字母表示同一品种不同处理间差异显著(P<0.05)。
Figure 1. Changes on tomato root activity under treatments
Datas with different lowercase letters indicate significant differences between treatments on same tomato variety at P<0.05.
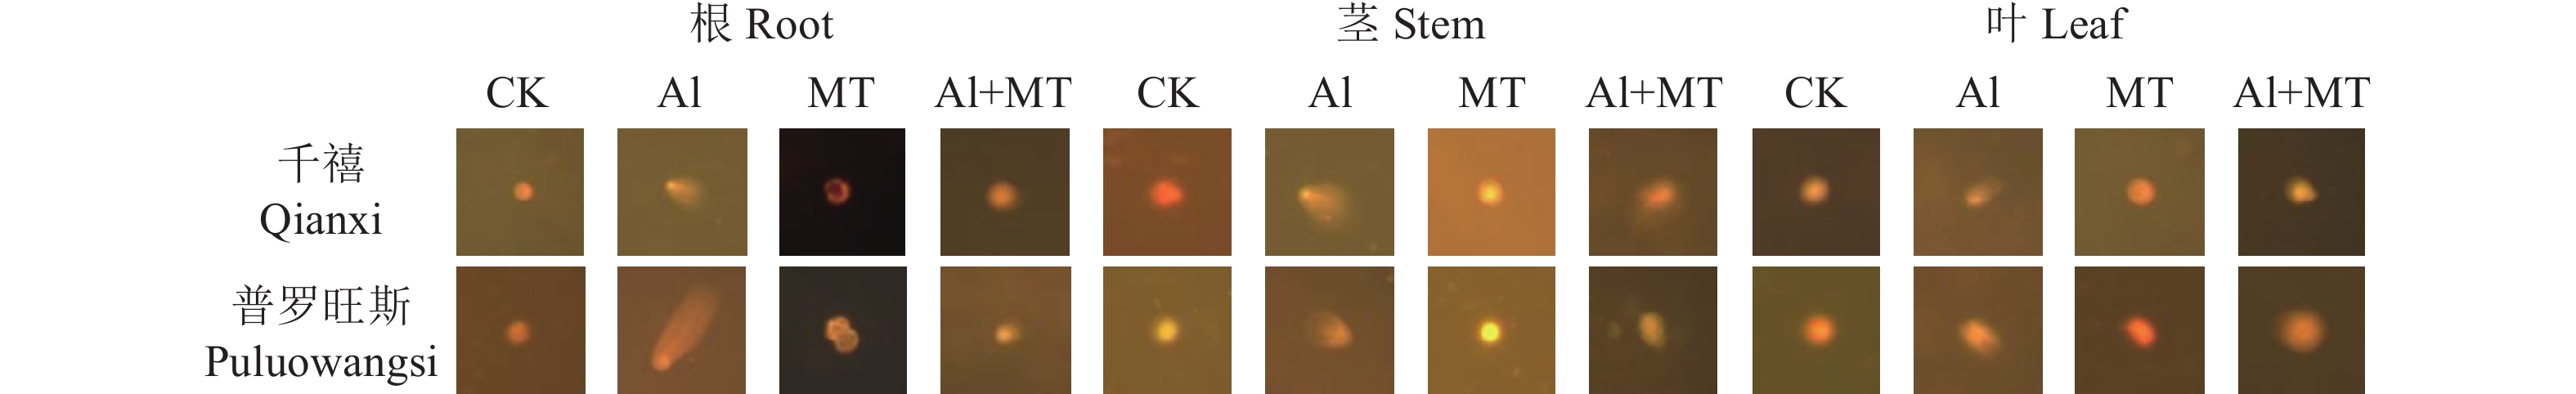
![]()
图 2 外源MT对铝胁迫下番茄DNA损伤的影响
Figure 2. Effect of MT on DNA damage on tomato plants under Al-stress
表 1 外源MT对铝胁迫下番茄生长特性的影响
Table 1 Effect of MT on growth of tomato plants under Al-stress
品种
Varieties处理组
Treatments株高
Plant height/cm叶面积
leaf area/cm2根长
Root length/cm千禧 Qianxi CK 64.25±1.35 b 49.16±2.60 a 9.75±0.76 a Al 59.32±1.44 c 33.09±2.24 b 4.33±2.35 b MT 69.16±2.07 a 60.76±3.14 a 11.59±1.35 a Al+MT 65.92±3.12 b 55.40±1.47 a 10.47±1.32 a 普罗旺斯 Puluowangsi CK 59.37±1.21 b 37.95±1.24 a 12.64±1.84 a Al 51.31±2.74 c 25.88±3.27 b 8.24±2.46 b MT 62.81±2.68 a 41.84±1.55 a 16.05±1.27 a Al+MT 60.44±1.67 ab 39.62±2.47 a 14.18±0.55 a 表内数据为平均值±标准误差,同项同列数据后相同字母表示无显著差异(P > 0.05),下同。
Datas are mean ± standard error; those with same letter on same line indicate no significant difference ( P>0.05). Same for below.  下载: 导出CSV
表 2 外源MT对铝胁迫下番茄抗氧化酶的影响
Table 2 Effects of MT on antioxidant enzymes of tomato plants under Al-stress
测量指标
Measured indicators处理
Treatment千禧 Qianxi 普罗旺斯 Puluowangsi 10 d 20 d 30 d 10 d 20 d 30 d SOD/(U·g−1) CK 3902.26±334.93 b 950.64±36.19 c 675.79±15.47 a 4457.17±75.413 a 906.62±17.75 d 583.64±12.05 b AI 6536.58±237.21 a 1288.10±16.24 ab 529.74±5.01 b 5609.25±138.00 a 1139.10±25.28 b 472.19±7.09 c MT 4421.31±299.02 b 1142.93±41.86 bc 694.85±33.19 a 4712.67±180.63 a 1041.19±24.62 c 595.65±29.14 b AI+MT 8008.05±193.70 a 1407.24±34.62 a 629.48±11.85 a 6600.04±281.52 a 1314.23±32.45 a 813.36±28.87 a POD/
(△OD470·min−1·g−1)CK 58.25±2.72 a 75.33±2.21 b 163.72±7.11 c 110.56±12.98 bc 113.50±8.86 b 118.62±10.85 c AI 55.01±14.66 c 95.76±11.25 b 97.96±13.18 d 42.86±8.97 bc 138.95±9.53 ab 95.42±4.70 d MT 64.88±7.39 ab 80.43±11.95 b 192.96±3.54 b 93.16±6.10 bc 124.86±8.80 ab 171.23±6.18 b AI+MT 73.31±3.57 a 184.41±26.62 a 238.29±9.09 a 114.05±7.30 ab 152.73±5.39 a 193.36±10.77 a CAT/
(μmol·min−1·g−1)CK 5.89±1.53 c 18.36±3.04 b 58.60±1.42 b 9.06±0.99 d 18.50±3.72 d 73.77±1.31 b AI 24.54±3.74 b 32.18±2.51 b 53.00±0.98 c 69.52±2.06 c 60.60±0.92 c 52.53±1.32 c MT 12.03±3.40 c 21.47±4.46 b 29.31±1.43 b 63.31±1.43 b 73.77±0.49 b 83.63±1.89 a AI+MT 61.12±1.96 a 77.17±1.21 a 74.67±1.39 a 74.67±1.39 a 89.77±2.03 a 82.17±1.88 a
下载: 导出CSV
表 3 外源MT对铝胁迫下番茄内源性抗氧化物的影响
Table 3 Effect of MT on antioxidants in tomato plants under Al-stress
测量指标
Measured indicators处理
Treatment千禧 Qianxi 普罗旺斯 Puluowangsi 10 d 20 d 30 d 10 d 20 d 30 d GSH含量
GSH content/(μmol·g−1)CK 0.44±0.01 d 1.07±0.043 a 1.06±0.05 c 0.66±0.01 d 1.11±0.02 b 1.10±0.02 b AI 1.14±0.01 b 0.86±0.03 a 0.89±0.03 d 1.09±0.02 b 1.06±0.02 c 0.66±0.02 c MT 0.61±0.01 c 1.20±0.02 a 1.69±0.02 a 0.71±0.01 c 1.26±0.01 b 1.30±0.04 a AI+MT 1.20±0.02 a 1.65±0.09 a 1.49±0.05 b 1.13±0.02 a 1.57±0.01 a 1.39±0.02 a AsA含量
AsA content/(mg·g−1)CK 0.03±0.01 d 0.18±0.02 c 0.22±0.03 b 0.14±0.01 d 0.12±0.01 d 0.20±0.02 b AI 0.36±0.01 b 0.39±0.01 b 0.11±0.02 c 0.30±0.05 b 0.28±0.05 b 0.13±0.02 c MT 0.36±0.01 c 0.41±0.02 ab 0.37±0.02 a 0.16±0.03 c 0.16±0.04 c 0.22±0.02 b AI+MT 0.40±0.02 a 0.44±0.02 a 0.36±0.03 a 0.31±0.03 a 0.29±0.03 a 0.26±0.04 a
下载: 导出CSV
表 4 外源MT对铝胁迫下番茄脯氨酸和MDA含量的影响
Table 4 Effects of MT on Pro and MDA contents in tomato plants under Al-stress
测量指标
Measured indicators处理
Treatment千禧 Qianxi 普罗旺斯 Puluowangsi 10 d 20 d 30 d 10 d 20 d 30 d MDA含量
MDA content/(nmol·g−1)CK 8.08±0.71 b 6.98±0.40 b 6.19±0.49 c 6.41±0.24 b 6.27±0.72 ab 7.77±0.65 c AI 9.47±0.65 a 8.03±0.47 a 8.01±0.48 a 7.49±0.73 a 7.11±0.70 a 10.17±0.93 a MT 3.43±0.95 ab 4.12±1.15 b 5.83±0.68 c 2.36±0.46 c 5.49±0.52 b 6.95±0.80 c AI+MT 8.75±0.63 c 6.76±0.65 c 6.82±0.62 b 7.20±0.22 a 6.52±0.85 ab 8.72±0.38 b 脯氨酸含量
Proline content/(mg·g−1)CK 4.94±1.33 c 6.39±1.16 c 16.47±1.90 d 2.24±0.97 c 5.10±1.91 b 13.12±1.20 b AI 5.54±1.63 c 9.63±1.43 b 20.23±1.20 c 3.77±0.99 c 8.26±1.82 b 14.43±2.09 b MT 9.64±1.15 b 14.39±1.23 a 34.06±1.06 b 6.48±1.54 b 12.34±2.00 a 25.86±2.03 a AI+MT 12.64±1.20 a 15.34±2.21 a 45.53±2.08 a 13.25±2.86 a 13.89±3.00 a 28.16±3.06 a
下载: 导出CSV
表 5 外源MT对铝胁迫下番茄光合特性的影响
Table 5 Effects of MT on photosynthetic characteristics of tomato plants under Al-stress
测量指标
Measured indicators处理
Treatment千禧 Qianxi 普罗旺斯 Puluowangsi 10 d 20 d 30 d 10 d 20 d 30 d SPAD值
SPAD valueCK 28.17±0.37 a 28.60±0.12 b 35.30±0.32 b 31.37±0.62 b 35.87±0.47 b 35.00±0.38 b AI 24.97±0.32 b 25.67±0.26 c 27.30±0.32 c 28.93±0.77 b 29.67±0.23 c 30.27±0.43 c MT 28.23±0.38 a 30.43±0.32 a 37.03±0.08 a 36.10±0.98 a 40.37±0.27 a 38.73±0.68 a AI+MT 27.03±0.46 a 28.93±0.20 b 34.53±0.55 b 31.40±1.36 b 36.27±0.45 b 34.40±0.10 b 初始荧光
FoCK 0.10±0.03 a 0.11±0.04 b 0.11±0.02 c 0.10±0.03 b 0.10±0.07 d 0.11±0.06 c AI 0.09±0.01 a 0.13±0.04 a 0.13±0.07 a 0.12±0.04 a 0.16±0.01 a 0.18±0.05 a MT 0.06±0.03 c 0.07±0.06 d 0.09±0.05 d 0.09±0.06 c 0.11±0.07 c 0.11±0.04 c AI+MT 0.08±0.02 b 0.09±0.05 c 0.11±0.05 b 0.11±0.03 b 0.12±0.04 b 0.14±0.03 b PSII 最大光化学量子产量
Fv /F mCK 0.92±0.03 b 0.93±0.02 a 0.93±0.04 a 0.82±0.03 d 0.81±0.02 b 0.82±0.03 b AI 0.84±0.02 d 0.73±0.03 d 0.69±0.02 c 0.72±0.03 b 0.65±0.03 d 0.61±0.02 d MT 1.04±0.01 a 1.00±0.01 a 0.94±0.02 a 0.94±0.02 a 0.93±0.03 a 0.95±0.03 a AI+MT 0.88±0.01 c 0.78±0.03 c 0.75±0.01 b 0.79±0.01 c 0.71±0.01 c 0.70±0.02 c
下载: 导出CSV
表 6 外源MT对铝胁迫下番茄铝富集效能的影响
Table 6 Effect of MT on Al-accumulation of tomato plants under Al-stress
品种 处理 Al含量 Al content/(mg·kg-1) Al富集系数 Al enrichment factor 转运系数
Coefficient of transshipment根
Root茎
Stem叶
Leaf土壤
Soil根
Root茎
Stem叶
Leaf千禧 Qianxi CK 0.13±0.00 c 0.10±0.00 b 0.07±0.01 c 0.83±0.03 bc 0.16±0.01 b 0.12±0.01 b 0.08±0.01 ab 1.29±0.005 a Al 0.22±0.02 a 0.14±0.00 a 0.10±0.02 ab 1.02±0.01 a 0.21±0.02 a 0.14±0.01 a 0.10±0.01 a 1.16±0.003 b MT 0.12±0.02 c 0.07±0.01 b 0.06±0.01 b 0.86±0.02 c 0.15±0.02 b 0.09±0.01 c 0.07±0.02 b 1.09±0.002 c Al+MT 0.18±0.01 b 0.13±0.01 a 0.09±0.01 ab 1.11±0.03 ab 0.17±0.01 b 0.12±0.02 b 0.08±0.01 b 1.20±0.002 b 普罗旺斯 Puluo wangsi CK 0.11±0.01 b 0.09±0.01 b 0.05±0.01 b 0.82±0.06 c 0.13±0.01 a 0.11±0.02 ab 0.06±0.01 b 1.37±0.003 b Al 0.15±0.01 a 0.13±0.01 a 0.09±0.001 a 1.02±0.01 ab 0.15±0.03 a 0.13±0.01 a 0.09±0.01 a 1.47±0.004 a MT 0.10±0.01 b 0.08±0.01 b 0.05±0.006 b 0.85±0.03 bc 0.12±0.01 a 0.10±0.01 b 0.06±0.01 b 1.38±0.002 b Al+MT 0.14±0.01 a 0.12±0.01 a 0.08±0.002 a 1.10±0.01 a 0.14±0.01 a 0.11±0.01 b 0.07±0.01 ab 1.32±0.001 c
下载: 导出CSV
-
[1] KIMMEL K, FUREY G N, HOBBIE S E, et al. Diversity-dependent soil acidification under nitrogen enrichment constrains biomass productivity [J]. Global Change Biology, 2020, 26(11): 6594−6603. DOI: 10.1111/gcb.15329
[2] RIAZ M, YAN L, WU X W, et al. Boron reduces aluminum-induced growth inhibition, oxidative damage and alterations in the cell wall components in the roots of trifoliate orange [J]. Ecotoxicology and Environmental Safety, 2018, 153: 107−115. DOI: 10.1016/j.ecoenv.2018.02.002
[3] YANG Y, MA L, ZENG H, et al. iTRAQ-based proteomics screen for potential regulators of wheat (Triticum aestivum L. ) root cell wall component response to Al stress [J]. Gene, 2018, 675: 301−311. DOI: 10.1016/j.gene.2018.07.008
[4] 黄凯, 张红宇, 张菡倩, 等. 植物应答铝毒的分子机制研究进展 [J]. 生物技术通报, 2021, 37(3):125−135. HUANG K, ZHANG H Y, ZHANG H Q, et al. Research progress on the molecular mechanism of plants response to aluminum toxicity [J]. Biotechnology Bulletin, 2021, 37(3): 125−135.(in Chinese)
[5] GATSIOS A, NTATSI G, YFANTOPOULOS D, et al. Effects of different organic soil amendments on nitrogen nutrition and yield of organic greenhouse tomato crop [J]. Nitrogen, 2021, 2(3): 347−358. DOI: 10.3390/nitrogen2030024
[6] YANG Q A, PENG Z P, MA W N, et al. Melatonin functions in priming of stomatal immunity in Panax notoginseng and Arabidopsis thaliana [J]. Plant Physiology, 2021, 187(4): 2837−2851. DOI: 10.1093/plphys/kiab419
[7] ZAHEDI S M, HOSSEINI M S, FAHADI H N, et al. Exogenous melatonin mitigates salinity-induced damage in olive seedlings by modulating ion homeostasis, antioxidant defense, and phytohormone balance [J]. Physiologia Plantarum, 2021, 173(4): 1682−1694. DOI: 10.1111/ppl.13589
[8] SAMI A, SHAH F A, ABDULLAH M, et al. Melatonin mitigates cadmium and aluminium toxicity through modulation of antioxidant potential in Brassica napus L [J]. Plant Biology, 2020, 22(4): 679−690. DOI: 10.1111/plb.13093
[9] POSMYK M M, KURAN H N, MARCINIAK K, et al. Presowing seed treatment with melatonin protects red cabbage seedlings against toxic copper ion concentrations [J]. Journal of Pineal Research, 2008, 45(1): 24−31. DOI: 10.1111/j.1600-079X.2007.00552.x
[10] 赵海亮, 左璐, 马长恩, 等. 果实膨大期叶面喷施褪黑素对番茄品质的影响 [J]. 北方园艺, 2021(17):15−21. ZHAO H L, ZUO L, MA C E, et al. Effects of foliar spraying melatonin on fruit quality of tomato during fruit expansion [J]. Northern Horticulture, 2021(17): 15−21.(in Chinese)
[11] 许秋怡, 陈兆晖, 季富宴, 等. 褪黑素增强盐害条件下水稻幼苗对稻瘟病的抗病能力 [J]. 安徽农业科学, 2018, 46(9):126−128. XU Q Y, CHEN Z H, JI F Y, et al. Melatonin enhancing resistance of rice seedlings to rice blast under salt stress [J]. Journal of Anhui Agricultural Sciences, 2018, 46(9): 126−128.(in Chinese)
[12] ZHAO C F, YANG M, WU X, et al. Physiological and transcriptomic analyses of the effects of exogenous melatonin on drought tolerance in maize (Zea mays L. ) [J]. Plant Physiology and Biochemistry, 2021, 168: 128−142. DOI: 10.1016/j.plaphy.2021.09.044
[13] 李阳, 陈静, 刘绍东, 等. 外源褪黑素对盐胁迫下棉花幼苗生长及光合特性的影响 [J]. 新疆农业科学, 2021, 58(8):1418−1426. LI Y, CHEN J, LIU S D, et al. Effects of exogenous melatonin on growth and photosynthetic characteristics of cotton seedlings under salt stress [J]. Xinjiang Agricultural Sciences, 2021, 58(8): 1418−1426.(in Chinese)
[14] 李方一, 黄璜, 官春云. 作物叶面积测量的研究进展 [J]. 湖南农业大学学报(自然科学版), 2021, 47(3):274−282. LI F Y, HUANG H, GUAN C Y. Review on measurement of crop leaf area [J]. Journal of Hunan Agricultural University (Natural Sciences), 2021, 47(3): 274−282.(in Chinese)
[15] SHIBAEVA T G, MAMAEV A V, SHERUDILO E G. Evaluation of a SPAD-502 plus chlorophyll meter to estimate chlorophyll content in leaves with interveinal chlorosis [J]. Russian Journal of Plant Physiology, 2020, 67(4): 690−696. DOI: 10.1134/S1021443720040160
[16] 努尔凯麦尔·木拉提, 杨亚杰, 帕尔哈提·阿布都克日木, 等. 小麦叶绿素含量测定方法比较 [J]. 江苏农业科学, 2021, 49(9):156−159. NURKHEIMER M, YANG Y J, PARHATI A, et al. Comparative study on determination methods of chlorophyll content in wheat [J]. Jiangsu Agricultural Sciences, 2021, 49(9): 156−159.(in Chinese)
[17] LIU Y, ZHANG J M. Lanthanum promotes bahiagrass (Paspalum notatum) roots growth by improving root activity, photosynthesis and respiration [J]. Plants, 2022, 11(3): 382. DOI: 10.3390/plants11030382
[18] 王敏, 宁秋燕, 石元值. 茶树幼苗对不同浓度铝的生理响应差异研究 [J]. 茶叶科学, 2017, 37(4):356−362. WANG M, NING Q Y, SHI Y Z. Study on physiological response of tea plant(Camellia sinensis) seedlings to different aluminum concentrations [J]. Journal of Tea Science, 2017, 37(4): 356−362.(in Chinese)
[19] ARNAO M B, HERNÁNDEZ-RUIZ J. Melatonin: A new plant hormone and/or a plant master regulator? [J]. Trends in Plant Science, 2019, 24(1): 38−48. DOI: 10.1016/j.tplants.2018.10.010
[20] 李格, 孟小庆, 蔡敬, 等. 活性氧在植物非生物胁迫响应中功能的研究进展 [J]. 植物生理学报, 2018, 54(6):951−959. LI G, MENG X Q, CAI J, et al. Advances in the function of reactive oxygen species in plant responses to abiotic stresses [J]. Plant Physiology Journal, 2018, 54(6): 951−959.(in Chinese)
[21] JIAO C J, LAN G P, SUN Y H, et al. Dopamine alleviates chilling stress in watermelon seedlings via modulation of proline content, antioxidant enzyme activity, and polyamine metabolism [J]. Journal of Plant Growth Regulation, 2021, 40(1): 277−292. DOI: 10.1007/s00344-020-10096-2
[22] 蒋希瑶, 黄俊杰, 周英杰, 等. 不同浓度外源褪黑素对NaHCO3胁迫下番茄幼苗生长和生理指标的影响 [J]. 北方园艺, 2022(9):1−9. JIANG X Y, HUANG J J, ZHOU Y J, et al. Effects of exogenous melatonin on growth and physiological indexes of tomato seedlings under NaHCO3 stress [J]. Northern Horticulture, 2022(9): 1−9.(in Chinese)
[23] 杜昕, 李博, 毛鲁枭, 等. 褪黑素对干旱胁迫下大豆产量及AsA-GSH循环的影响 [J]. 作物杂志, 2022(1):174−178. DU X, LI B, MAO L X, et al. Effects of melatonin on yield and AsA-GSH cycle in soybean under drought stress [J]. Crops, 2022(1): 174−178.(in Chinese)
[24] 陈奋奇, 方鹏, 白明兴, 等. 外源脯氨酸缓解玉米幼苗盐胁迫的效应 [J]. 草业科学, 2022, 39(4):747−755. CHEN F Q, FANG P, BAI M X, et al. Mitigation of salt stress in maize seedlings by exogenous proline application [J]. Pratacultural Science, 2022, 39(4): 747−755.(in Chinese)
[25] GUO M X, ZHANG X T, LIU J J, et al. OsProDH negatively regulates thermotolerance in rice by modulating proline metabolism and reactive oxygen species scavenging [J]. Rice, 2020, 13(1): 61. DOI: 10.1186/s12284-020-00422-3
[26] 吕婷. 褪黑素对小麦铝毒的缓解作用及其机理研究[D]. 杭州: 浙江大学, 2018. LV T. The role of melatonin in alleviating aluminum toxicity in wheat(Triticum aestivum L. )genotypes differing in aluminum tolerance[D]. Hangzhou: Zhejiang University, 2018. (in Chinese)
[27] HOU X L, HAN H, CAI L P, et al. Pb stress effects on leaf chlorophyll fluorescence, antioxidative enzyme activities, and organic acid contents of Pogonatherum crinitum seedlings [J]. Flora, 2018, 240: 82−88. DOI: 10.1016/j.flora.2018.01.006
[28] 尹赜鹏, 王珍琪, 齐明芳, 等. 外施褪黑素对盐胁迫下番茄幼苗光合功能的影响 [J]. 生态学杂志, 2019, 38(2):467−475. DOI: 10.13292/j.1000-4890.201902.023 YIN Z P, WANG Z Q, QI M F, et al. Effects of melatonin application on photosynthetic function in tomato seedlings under salt stress [J]. Chinese Journal of Ecology, 2019, 38(2): 467−475.(in Chinese) DOI: 10.13292/j.1000-4890.201902.023
[29] HOSSEIN P A, ÖZKAN G, BALPINAR N Ö, et al. Estimation of genomic instability and DNA methylation due to aluminum (Al) stress in wheat (Triticum aestivum L. ) using iPBS and CRED-iPBS analyses [J]. Turkish Journal of Botany, 2019, 43(1): 27−37. DOI: 10.3906/bot-1804-23
[30] ACHARY V M M, PARINANDI N L, PANDA B B. Calcium channel blockers protect against aluminium-induced DNA damage and block adaptive response to genotoxic stress in plant cells [J]. Mutation Research/Genetic Toxicology and Environmental Mutagenesis, 2013, 751(2): 130−138. DOI: 10.1016/j.mrgentox.2012.12.008
[31] HE S J, HU Y J, WANG H B, et al. Effects of indole-3-acetic acid on arsenic uptake and antioxidative enzymes in Pteris cretica var. nervosa and Pteris ensiformis [J]. International Journal of Phytoremediation, 2017, 19(3): 231−238. DOI: 10.1080/15226514.2016.1207609
[32] NAZIR H, ASGHAR H N, AHMAD Z Z, et al. Judicious use of kinetin to improve growth and yield of rice in nickel contaminated soil [J]. International Journal of Phytoremediation, 2016, 18(7): 651−655. DOI: 10.1080/15226514.2015.1094444
-
期刊类型引用(1)
1. 郭勇,王洪,邱雯婷,陈雄,陈美香,郭建,黄晨楹,刘银春. 植物特征光谱测试系统研制及应用. 农业工程. 2024(08): 62-66 .  百度学术
百度学术
其他类型引用(0)


计量
- 文章访问数: 916
- HTML全文浏览量: 350
- PDF下载量: 25
- 被引次数: 1
